
UNCTAD's World Investment Report 2026 gave Nigeria a headline recovery: $4 billion in FDI, back in Africa's Top 5. Roughly half was one oil deal. The productivity thesis holds.
By Wole Ogundare, Founder and Managing Partner, Carthena Advisory
The World Investment Report 2026, released by UNCTAD on 7 July, gave Nigeria a headline recovery. Foreign direct investment doubled from $1.61 billion in 2024 to $4.01 billion in 2025, up 148%. Nigeria returned to Africa's top five investment destinations for the first time since 2021. The country's stock of inward FDI rose to $92.9 billion. On the surface, it reads as vindication of the reform agenda.
Two things about that headline need to be said before it becomes the consensus reading. First, roughly half of Nigeria's $4 billion was a single oil and gas international project finance deal valued at about $2 billion. Second, essentially all of the balance was extractive: hydrocarbons, refining, battery storage. Two of the largest recorded transactions of the year were ownership transfers of existing assets, Renaissance Africa Energy buying Shell's onshore business and Huaxin Cement buying Lafarge Africa. Not one greenfield productive facility of consequence was announced. Not one integrated agro-processor. Not one pharmaceutical company with local production. Not one technology firm with engineering depth based in Nigeria.
This is what Nigeria's productivity failure looks like when the FDI number is going up. The reforms have not yet reached the constraints that determine whether foreign capital builds productive capacity in the country. The 2025 numbers are consistent with, not contradictory to, the thirty year productivity trend. What follows is why.
1. Two headlines, one country, both true
Nigeria's own National Bureau of Statistics published its 2025 capital importation totals in February 2026. Of $23.22 billion in total inflows for the year, only $923 million was recorded as foreign direct investment. That is 3.97%. UNCTAD, five months later, reports Nigerian FDI at $4.01 billion for the same period. The two numbers are not in contradiction. They measure different things.
NBS captures capital that flows through Nigerian banking channels and is registered with the CBN, primarily equity investment in productive Nigerian enterprises. UNCTAD adds international project finance deals, cross-border acquisitions and reinvested earnings that never touch Nigerian FX channels. When Shell's onshore business is sold to a Nigerian-led consortium and the transaction is structured through offshore vehicles, UNCTAD counts it. NBS does not.
The gap between $923 million and $4.01 billion is the difference between the FDI Nigeria's productive economy actually received and the FDI foreign investors reported having exposure to. Both numbers are honest. The higher one is more comprehensive. The lower one is more indicative of what the Nigerian economy actually gets to use.
The point that follows from holding both numbers at once is that the composition of the higher number is what matters. If UNCTAD's $4 billion were flowing into Nigerian manufacturing, agro-processing, integrated logistics or pharmaceutical production, the gap with NBS would tell you Nigerian channels are under-capturing productive investment and the economy would be building capacity behind the reported number. What actually happened is that the higher UNCTAD number is composed of extractive project finance and asset transfers. Neither builds new productive capacity. Neither creates the jobs, the wages and the demand that a productivity recovery would require. NBS's leaner number is the closer read on Nigeria's productive economy in 2025.
2. The composition of the 2025 recovery
Decomposition of the $4.01 billion is the analytical work that has not yet been done in Nigerian commentary on the WIR 2026.
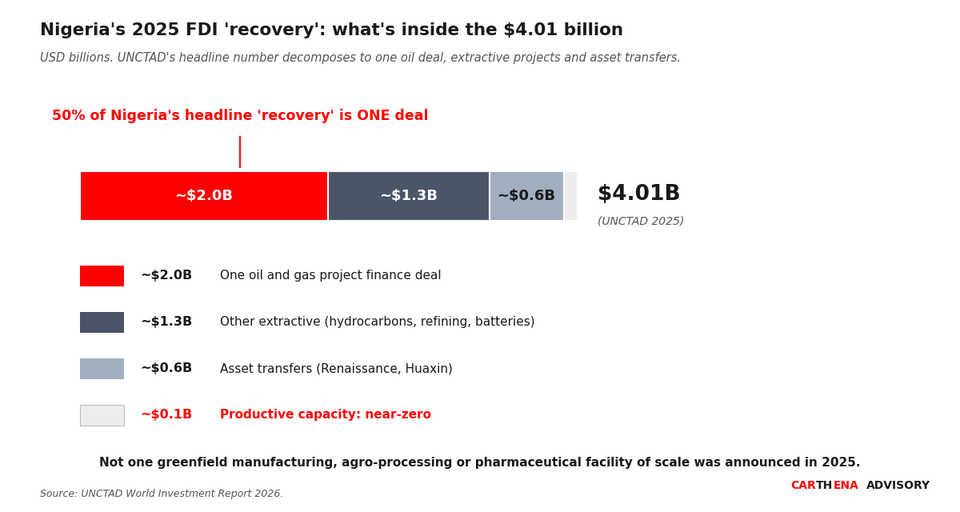
Roughly half of Nigeria's UNCTAD-recorded 2025 FDI was a single oil and gas project finance deal. Essentially none was productive-capacity investment. Source: UNCTAD World Investment Report 2026.
The single largest component was one oil and gas international project finance deal, valued at approximately $2 billion. UNCTAD identifies it in the country notes but does not disclose the counterparty. The rest was distributed across hydrocarbons, refining, battery storage and industrial production, with two named cross-border acquisitions materially featured: the Shell onshore sale to Renaissance and the Lafarge acquisition by Huaxin.
Two structural observations follow.
First, these are asset transfers, not capacity additions. Renaissance did not build a new oilfield. It bought an existing one. Huaxin did not build a new cement plant. It bought an existing one. When ownership of productive assets moves from one investor to another, UNCTAD records the transaction as FDI. The productive capacity of the Nigerian economy does not change. The workforce does not change. The output does not change. What changes is who receives the dividends. In productivity terms, these transactions are neutral, not positive.
Second, the extractive concentration is total. Not one line of Nigeria's 2025 FDI is in the productive-economy sectors that build broad-based national income: not agro-processing, not integrated pharmaceutical manufacturing, not technology infrastructure with engineering depth, not integrated retail or fintech at scale beyond payments, not automotive assembly, not textiles. The one oil deal, plus refining, plus battery storage (which in Nigeria typically means power-plant grade batteries for gas-to-power projects), plus hydrocarbons: this is a rentier portfolio. It is what Nigeria attracted before the reform agenda began, and it is what Nigeria attracted after three years of it.
The 2025 FDI number confirms Nigeria's structural position in the global capital allocation calculus. Foreign investors will commit to Nigerian extractive sectors because those sectors can be operated around the country's three binding constraints. Oil and gas offshore facilities generate their own power. Extractive dollar earnings do not need to be repatriated through the Nigerian FX regime; they are booked internationally and the parent company gets paid. Offshore production does not require Apapa. Everyone else, and this is the point that this piece and Issue 1 both make, faces the constraints head on, then leaves!
3. The exit wave, still named
The 2023 to 2024 exits of Shell, GlaxoSmithKline, Procter and Gamble, Unilever and Sanofi are the counter-evidence to the 2025 recovery reading. Five multinational operating businesses in five separate sectors chose to withdraw from productive operations in Nigeria in a two-year window. Each announcement cited some combination of the same three constraints: FX repatriation appeared in all five; power appeared in three; ports and logistics appeared in three.
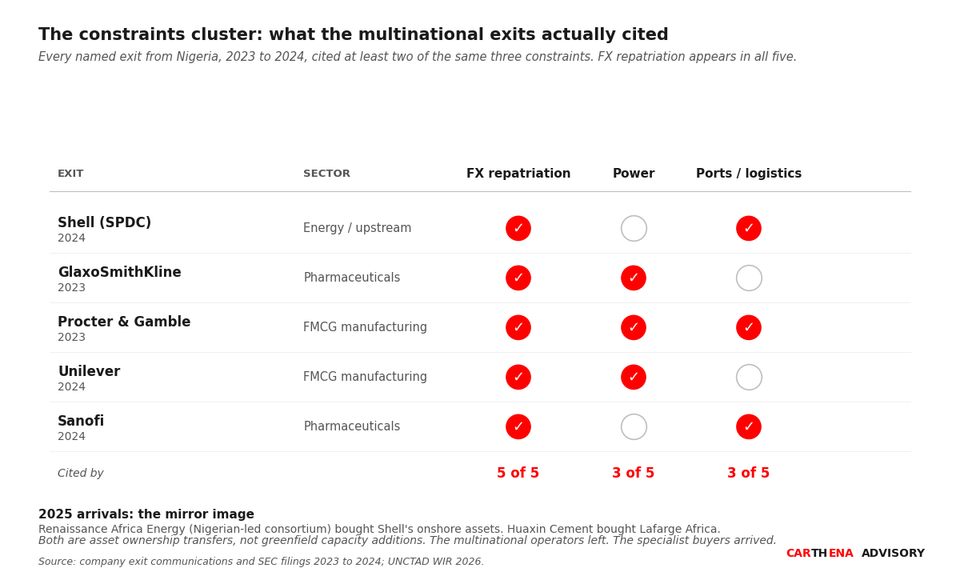
Every named multinational exit between 2023 and 2024 cited some combination of the same three structural constraints. FX repatriation was cited in all five. The 2025 arrivals (Renaissance, Huaxin) took what the exits left behind. Source: company exit communications and SEC filings; UNCTAD WIR 2026.
The 2025 arrivals are the mirror image. Renaissance Africa Energy bought what Shell was selling. Huaxin bought what Lafarge was divesting - neither transaction is a bet on Nigerian productive-economy expansion. They are bets on the residual value of assets that could no longer be operated profitably by their original owners under Nigerian conditions. That the buyers are a Nigerian-led consortium and a Chinese cement group respectively is analytically instructive; they are the class of investor that can carry the operational cost of Nigerian constraints because their alternatives elsewhere are also constrained. The multinational operators with global alternatives left. The specialist buyers with regional alternatives stayed.
The composition of who arrives and who leaves is the single clearest evidence of the productivity thesis. Nigeria is being sold to a narrower and narrower slice of the global investor base. The FDI number can go up while that trend continues. What the FDI number cannot do, without a change in the inherent constraints, is diversify away from the specialist extractive and asset-transfer buyer class that currently defines it.
4. The productivity chain, unchanged by the 2025 numbers
Nigeria's labour productivity grew at approximately 1.1% per year between 1997 and 2022, according to McKinsey Global Institute's Investing in Productivity Growth report of March 2024. Advanced economies grew at almost exactly the same rate over the same period, from a base that was 30 to 50 times higher in per worker output. Growing at the rich world's rate from a fraction of the rich world's starting position is the definition of failing to converge. The gap widens in absolute terms even as growth rates match.
The infrastructure deficit explains the productivity number directly and mechanically. Nigeria has 14.15 GW of installed electricity generation capacity for 220 million people. In 2025, the Nigerian Electricity Regulatory Commission reported that on any given day approximately 5,200 MW was available for dispatch, a Plant Availability Factor of 38%. Peak generation for the year was 5,801 MW, recorded on 4 March. Compare with Egypt's 63.45 GW installed for 110 million people, or South Africa's 63.43 GW for 60 million. On a per capita installed basis, the average Egyptian has access to roughly nine times the generation capacity available to the average Nigerian. The average South African, sixteen times.
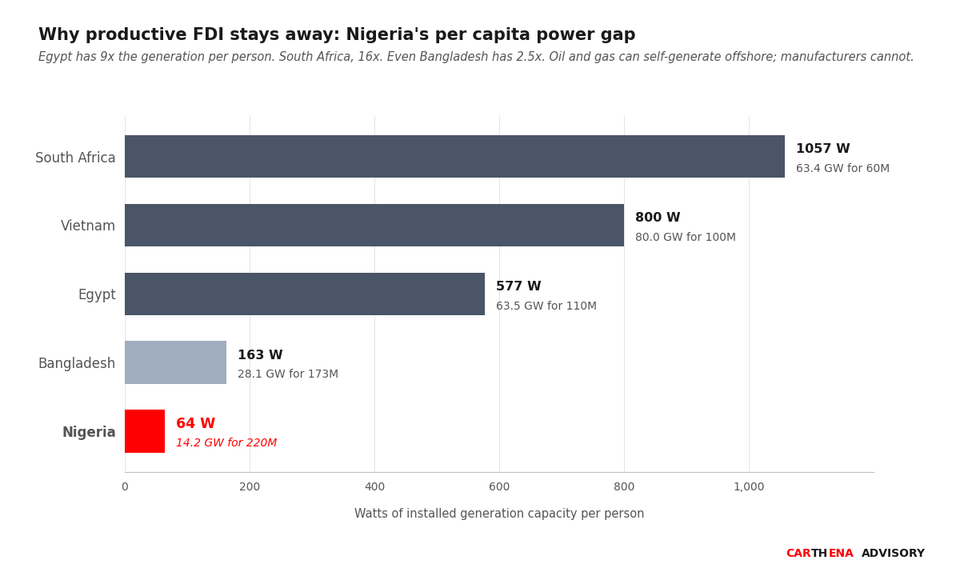
Nigeria's installed generation per person is 64 watts. Egypt is at 577. South Africa, 1,057. The number under-states the deficit by half: only 38% of Nigerian installed capacity is available for dispatch. Sources: NERC, Statbase 2024.
This is the constraint that the extractive FDI does not need to solve, and that the productive-economy FDI cannot operate around. A factory in Lagos or Ogun State does not have the option of self-generating from an offshore platform. It must build a parallel power system from diesel or gas, at a cost per kWh roughly four times what a comparable South African or Egyptian facility pays on grid. That cost is passed through to the price of Nigerian manufactured output. It is why a Vietnamese or Bangladeshi manufacturer of comparable skill, working with comparable capital, produces goods at roughly 30% lower cost before any other factor is considered.
The port situation is structurally identical. Apapa cargo dwell time averaged 15 days in Q1 2026 against an international best practice of 3 to 5 days. Dynamar, the Dutch maritime consultancy, estimates Nigeria loses ₦20 billion daily at its ports through inefficiency. Lekki Deep Sea Port now handles 40.6% of national throughput; Apapa is at 16.7%. The country has demonstrated it can operate a port to international standard when a new facility is built to bypass legacy operational practice. What it has not done is bring the legacy facilities to that standard.
The FX regime is the third leg. Foreign investors will not commit long term capital to a jurisdiction where dividend repatriation cannot be timed with confidence. The 2023 currency reforms and the 2024 to 2025 CBN tightening cycle have improved liquidity at the margin. The structural problem, that the queue for FX out remains materially longer than the queue for FX in, is unresolved.
5. Why low productivity is repelling foreign productive capital, not attracting it
Foreign direct investment is a discounted cash flow calculation made by a corporate or institutional investor with a global set of alternatives. The investor compares expected returns in Nigeria against expected returns in Vietnam, Egypt, Indonesia, Bangladesh, Côte d'Ivoire, Ethiopia and forty other emerging markets, all of which are competing for the same global FDI pool of approximately $1.6 trillion per year.
In that calculation, low productivity reduces expected returns in three ways. Output per unit of capital invested is lower, so the revenue line is smaller. The cost of the parallel infrastructure the investor must build reduces the operating margin. The volatility of the FX regime, the tariff regime and the regulatory environment requires the investor to apply a higher risk discount, which lowers the present value of every future cash flow.
The global context matters here, and the WIR 2026 sharpens it. Investment is concentrating. UNCTAD's own data shows the top 20 host economies received more than 80% of global FDI in 2025. Strategic sectors (AI infrastructure, semiconductors, critical minerals, energy transition technologies) took 44% of global greenfield project value in 2025, up from 16% in 2020. AI infrastructure alone absorbed $341 billion.
The sectors Nigeria would need to attract to build broad-based productive capacity are the sectors that are globally contracting in FDI terms. Announced greenfield investment and international project finance values in 2025 fell by $55 billion in infrastructure, by $37 billion in renewable energy, by $55 billion in GVC-intensive industries and by $31 billion in real estate. The industries that build productive economies for countries like Nigeria are shrinking in the FDI pool at the same time the industries Nigeria has no infrastructure to compete for are growing.
This is not a reason to lower ambition. It is a reason to sharpen focus. Nigeria's FDI target for the next five years is not to compete for AI infrastructure. It is to become one of the small number of emerging market destinations where the productive-capacity FDI that is still moving chooses to go. To do that, the country's offer to that class of investor has to change materially.
6. What a country that would attract serious productive FDI actually looks like
Vietnam attracted $18.5 billion in FDI in 2025. Egypt, on the underlying basis stripped of the Ras El-Hekma effect, attracted about $11.6 billion. Guinea attracted $7.76 billion in the same year on the back of two bauxite and iron ore projects, but that is the extractive concentration story again, not a productive-economy story. The countries that attract serious productive-capacity FDI at multi billion dollar scale share three characteristics that Nigeria does not currently share.
Power is available at a unit cost and reliability that lets factories plan production cycles around grid supply. Vietnam has 80 GW of installed capacity for 100 million people, roughly 800 watts per person. Egypt has 577 watts per person. Nigeria has 64 watts per person on installed, and closer to 24 watts per person on available capacity. The gap is not marginal. It is of a serious magnitude.
Foreign exchange flows in both directions with predictability. An investor knows dividends declared in year three will repatriate in year four without a nine month queue. This is codified in law, not left to central bank discretion. Vietnam publishes a forward FX curve. Egypt's post 2024 reforms committed to a market-clearing rate. Nigeria has moved in the same direction but has not yet completed the journey.
Goods move from port to inland market in five days, not fifteen. Vietnam moves cargo from Haiphong to Hanoi in under 48 hours. Egypt's Damietta and Alexandria dwell times are 4 to 6 days on a standard shipment. Ethiopia moves cargo from Djibouti to Addis in under 72 hours despite the geographic disadvantage. Nigeria is a country of 220 million with 15 day dwell times.
None of these three benchmarks is aspirational. Each is achieved today by an emerging market of comparable or smaller scale than Nigeria. The question is not whether the standard exists, it is whether the political will to reach it exists.
7. Three horizontal enablers, sequenced
The case for three horizontal enablers rather than a longer sectoral list was made in Issue 1 of The Carthena Read. The case for choosing power, FX regime and ports and logistics as those three follows from the diagnosis above. Each unlocks every sector at once. Fix power and manufacturing, agro-processing, data centres, cold chain and fintech infrastructure become viable simultaneously. Fix FX and every foreign investor's discount rate falls, lifting the present value of every future Nigerian cash flow. Fix the ports and the cost of imported inputs falls for every productive sector, while the cost of exported outputs falls for every exporter.
Each of the three has known international solutions. Egypt sequenced them across roughly 15 years, starting with power and moving to FX and ports. Vietnam sequenced them across roughly 20 years, starting with special economic zones that solved all three inside a bounded geography and then scaling out. Bangladesh sequenced them across 25 years, starting with textile export processing and building out - none of these was accidental. Each involved sustained policy focus and, critically, political durability across administrations.
For Nigeria, the sequencing question is important. Trying to reform all three at once has been attempted repeatedly and has failed each time because the political capital required exceeds what any one administration can hold. The Egyptian model of starting with power and using early productivity gains to build the political base for FX reform is instructive. The Vietnamese model of bounded geography SEZs is instructive. What is not instructive, because it has been tried and failed, is the pan-sectoral reform announcement followed by partial implementation followed by administration change.
The FDI number for 2026 will tell us whether the direction has changed. If the composition remains extractive dominant, with productive-capacity projects continuing to represent a small fraction of the total, the diagnosis is confirmed. If the composition begins to diversify toward integrated manufacturing, agro-processing or productive-capacity infrastructure, the political will is beginning to translate into structural change.
8. The single test
The test that would prove this diagnosis wrong is stated below, so that this analysis can be falsified rather than defended.
If Nigeria's 2026 or 2027 FDI composition, as measured by UNCTAD in the next two World Investment Reports, shows the productive-capacity share (integrated manufacturing, agro-processing, non-extractive infrastructure, technology) rising above 30% of the annual total, without a change in the three constraints, then the constraints are not binding as this analysis claims and the diagnosis is incomplete. The author would update the argument accordingly.
The reverse test is the one that matters more. If Nigeria's 2026 FDI is again dominated by oil and gas project finance and asset transfers, with productive-capacity investment below 15% of the total, then the current reform posture has produced improved macroeconomic conditions without materially changing the productivity constraints, and the recovery is what it appeared to be in 2025: a rentier bounce rather than a structural turn.
The path out is not hidden. Egypt walked it. Vietnam walked it. Bangladesh walked it. Each over a 15 to 25 year window. Each by addressing the same three constraints Nigeria has not addressed. The 2025 UNCTAD numbers gave Nigeria a headline that the reform agenda could point to. What the numbers did not do, when decomposed, is show that the underlying productivity failure has begun to reverse. The 2026 composition will tell us whether the reversal is underway.
Sources
- UN Conference on Trade and Development, World Investment Report 2026 (7 July 2026); annex tables 1 to 4 and Africa regional analysis.
- National Bureau of Statistics, Nigeria Capital Importation Reports Q1 to Q4 2025; full year release February 2026.
- BusinessDay Nigeria analysis of WIR 2026, 8 July 2026.
- McKinsey Global Institute, Investing in Productivity Growth, March 2024 (Exhibit 3).
- Nigerian Electricity Regulatory Commission, Operational Performance factsheets, September to December 2025.
- Statbase, Electricity Installed Capacity by Country, 2024 (Egypt 63.45 GW, South Africa 63.43 GW, Nigeria 14.15 GW, Vietnam 80 GW, Bangladesh 28.13 GW).
- Nigerian Ports Authority, 2025 Operational Performance Report; Sea Empowerment and Research Centre, port dwell time analysis Q1 2026; Dynamar Nigerian port loss estimate.
- Shell plc, GlaxoSmithKline plc, Procter and Gamble, Unilever plc, Sanofi public statements on Nigerian exits, 2023 to 2024.
- Vietnam General Statistics Office, FDI inflows 2025; Egypt Central Bank net FDI figures 2025.
If you would like to discuss what this analysis means for your portfolio, board or capital allocation strategy, please get in touch at info@carthenaadvisory.com.